
Overview
There are Two tables on the Facility Analyze page under the Destinations tab. As always, the tables under the Destinations tab show providers who had admitted patients discharged from the selected facility. In the hospice line of business, both hospice destinations and skilled nursing destinations are shown for patients enrolled in Medicare FFS.

 In this article
- Hospice Destinations
- SNF Destinations
Understanding the Metrics
Hospice Destinations
As the table title identifies, this table displays hospices that admitted Medicare FFS patients discharged from the selected facility. The metrics in the table will allow you to get a sense of the flow of patients from the selected facility to the listed hospices. In addition, you can identify the top hospice destinations, or evaluate the patients admitted to your hospice during the reporting period.
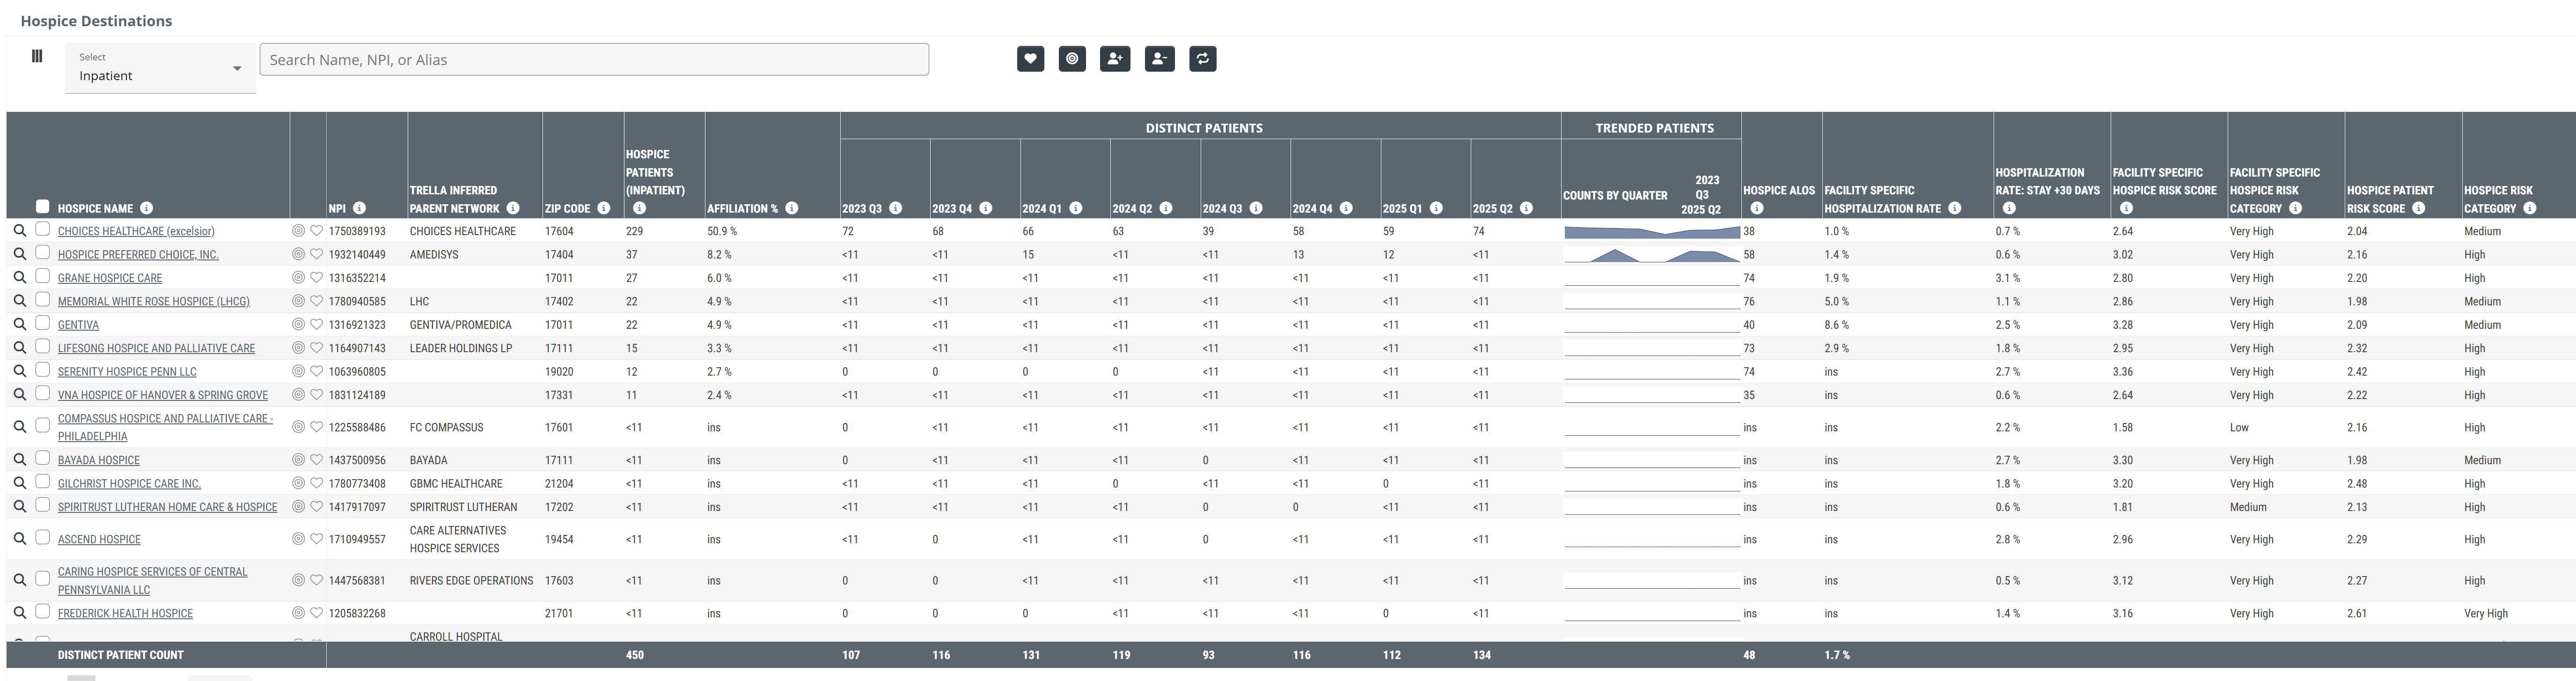
![]() Click on the above image to expand it.
Click on the above image to expand it.
Claim Type Dropdown
At the top left of the table there is a dropdown that allows you to choose the claim type from which the metrics in the table will be calculated. The options are shown in the image below.
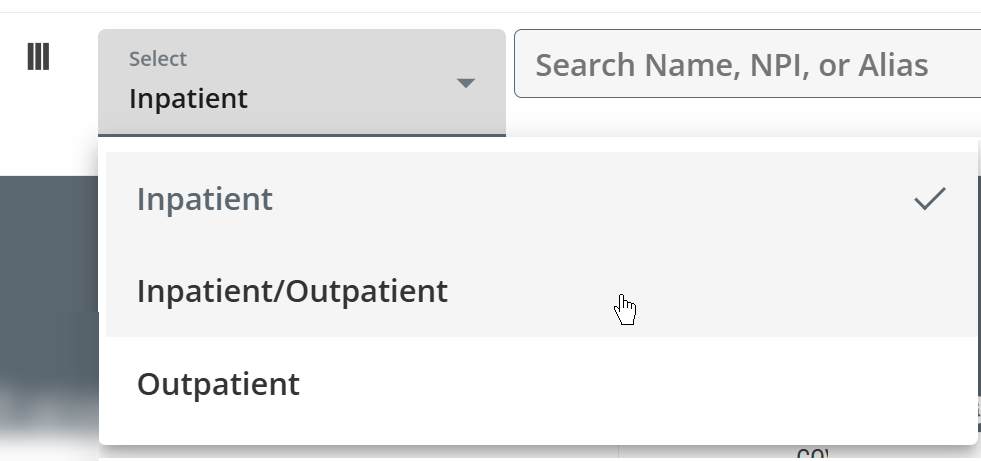
![]() This drop down allows you to choose which patient type you want to focus on.
This drop down allows you to choose which patient type you want to focus on.
| Metric | Description |
| Hospice Name | The official entity name of the hospice as listed in CMS Provider Data (NPI) file |
|
Favorites/Targets
|
Click on these icons to make the listed organization a Favorite (heart icon) or a Target (target icon). |
| NPI | National Provider Identifier number for the hospice in the row. This is maintained by CMS. |
| Trella Inferred Parent Network | If the listed hospice is aligned with a Trella Inferred Patent Network, the network ID is identified in this column. |
| ZIP Code | This is the ZIP Code the hospice has listed as their primary location, as pulled from the NPI Registry file. |
Hospice Patients (Inpatient  ) ) |
This metric is the count of distinct patients treated by the selected facility in the setting indicated (Inpatient, outpatient, etc.) who were admitted to the hospice in the row during the one year reporting period.
|
| Affiliation % | This metric is the percentage of distinct patients discharged from selected facility who were admitted to the hospice identified in each row during the one year reporting period. |
|
Distinct Patients - Counts by Quarter - 20YY-Q# |
This is the count of distinct patients treated by the selected facility who were admitted to the listed hospice during the quarter listed in the column header.
|
| Trended Patients |
This contains a graphical presentation of the Distinct Patients metrics to the left. This shows a visual trend of the patient admits to allow a quick evaluation.
|
| Hospice ALOS |
The average number of days completed at the listed hospice for patients who were discharged from the selected facility and admitted to the hospice within 30 days after discharge during the one-year reporting period
|
| Facility Specific Hospitalization Rate | The rate at which patients admitted ONLY FROM THIS FACILITY by the listed hospice were admitted to a short-term acute stay during or 30 days after discharge from their Hospice episode. |
| Hospitalization Rate: Stay + 30 Days |
The two-year rate at which all patients admitted by the listed hospice were admitted to any hospital during their stay or within 30 days after discharge.
|
| Facility Specific Hospice Risk Score |
Average Hierarchical Condition Category (HCC) patient risk score for patients who were discharged from the selected facility and admitted to listed the hospice within 30 days of discharge. In other words, this is a risk score calculated for the listed hospice, but only for patients discharged from the selected facility. |
| Facility Specific Patient Risk Category | The Trella Health categorization of the Facility Specific Hospice Risk Score |
| Hospice Patient Risk Score |
Average Hierarchical Condition Category (HCC) Patient Risk Score for the listed provider
|
| Hospice Risk Category |
Trella Health has created these categories to make a general comparison between organizations quick and easy.
|
SNF Destinations
As the table title identifies, this table displays skilled nursing facilities that admitted Medicare FFS patients discharged from the selected facility. The metrics in the table will allow you to get a sense of the flow of patients from the selected facility to the listed skilled nursing facilities.
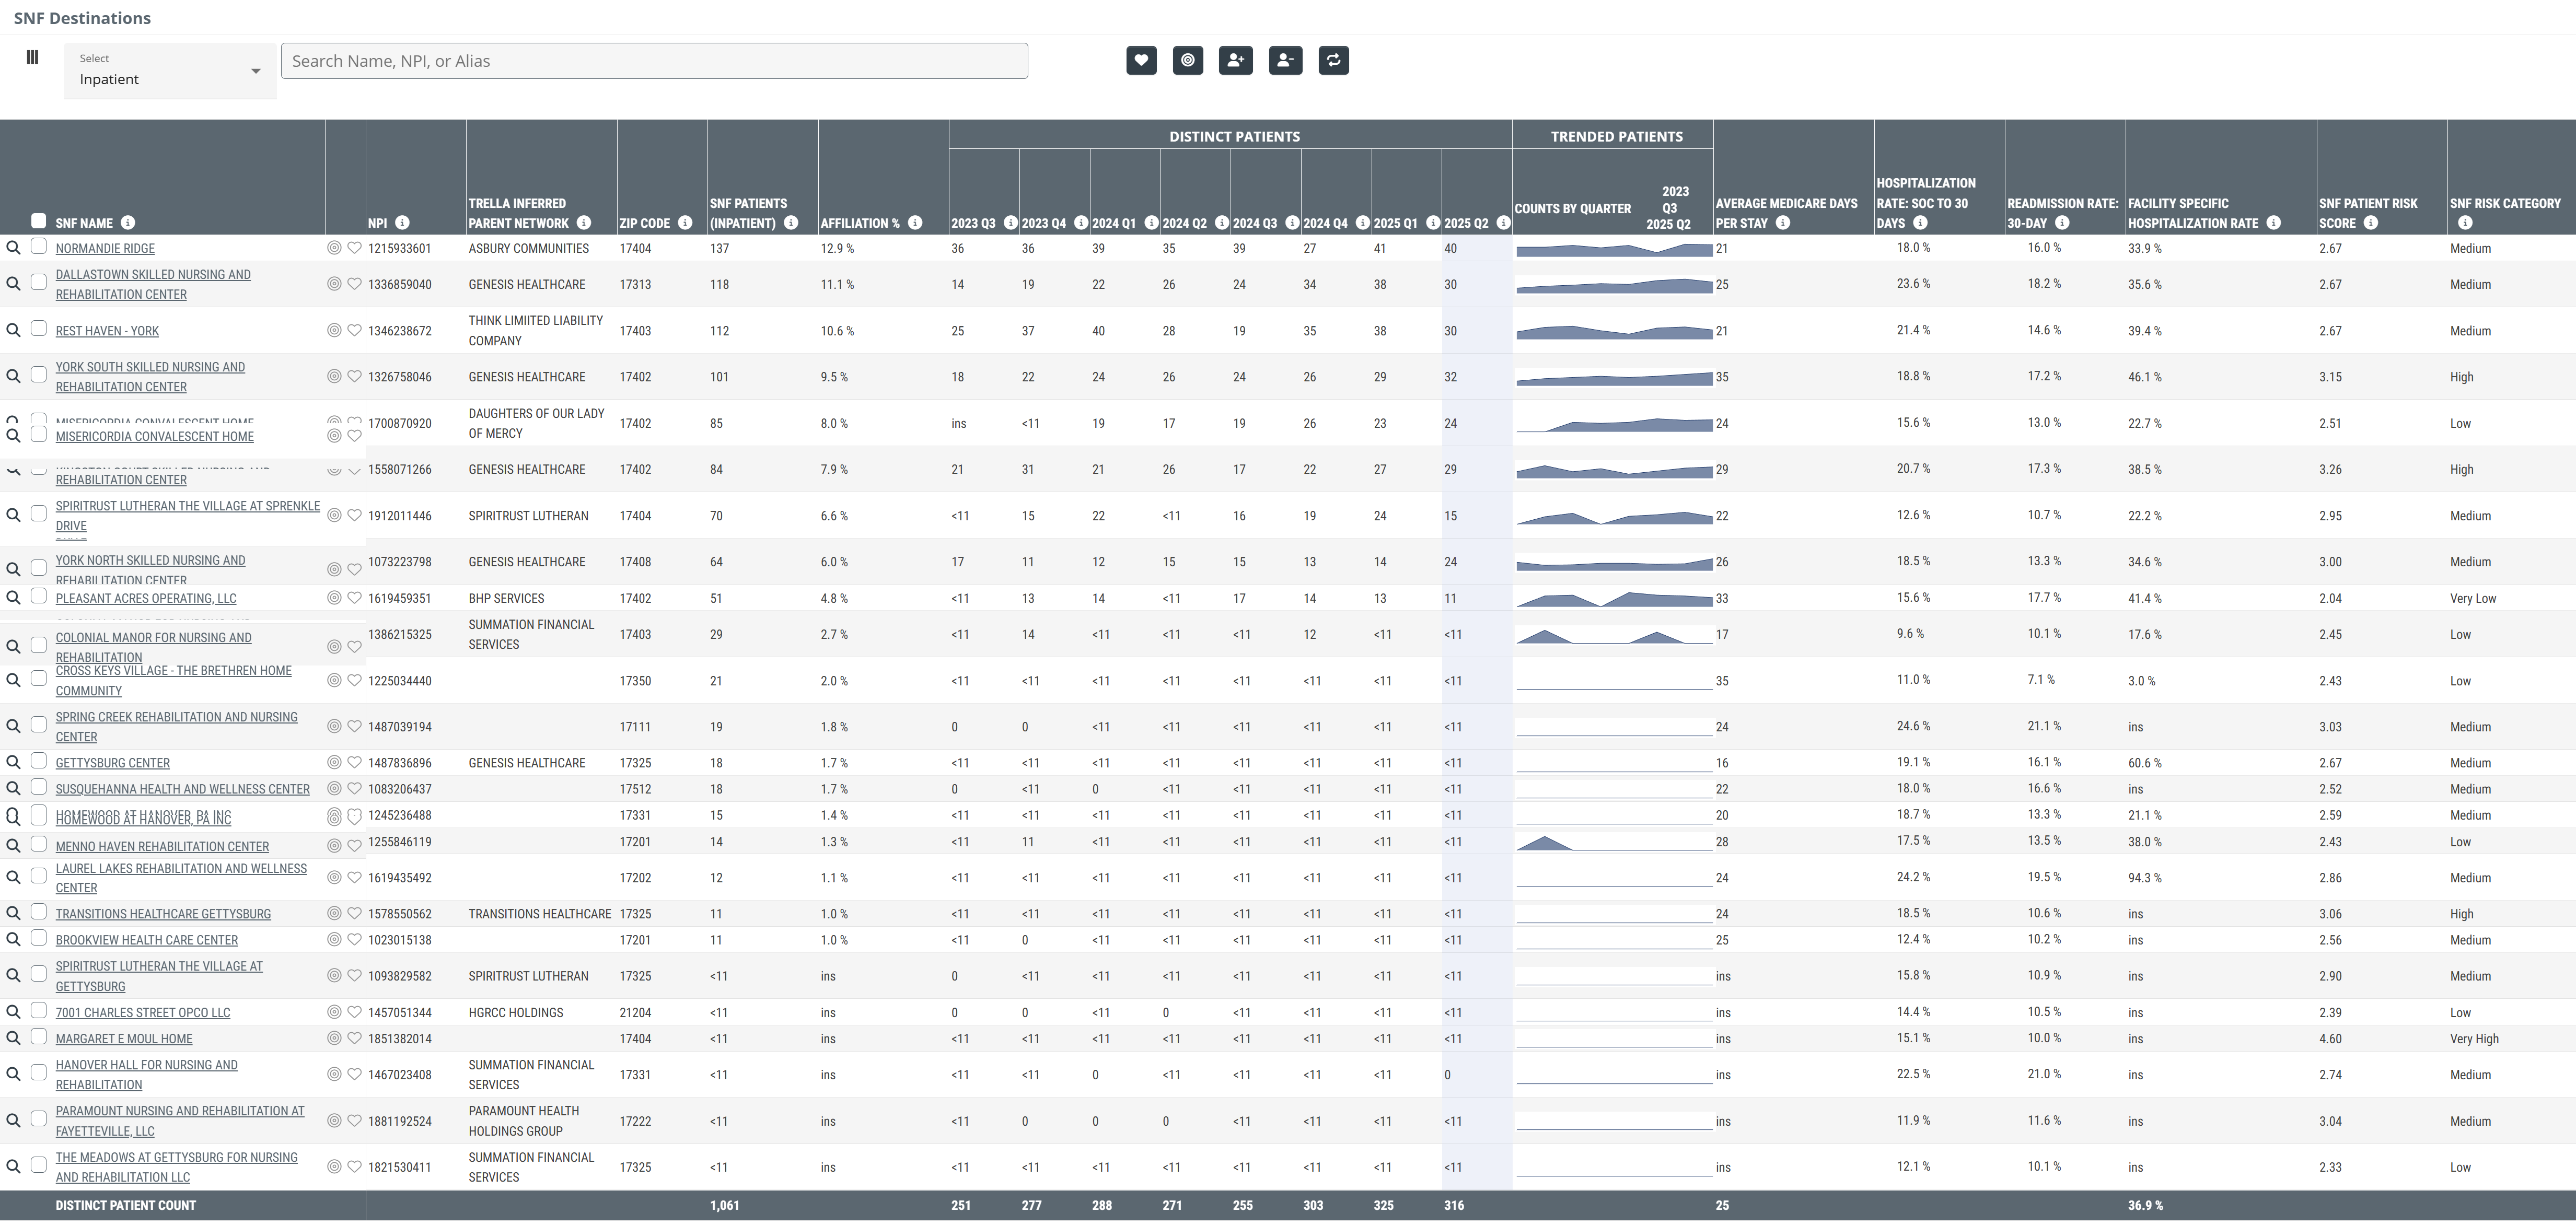
![]() Click on the above image to expand it.
Click on the above image to expand it.
Claim Type Dropdown
At the top left of the table there is a dropdown that allows you to choose the claim type from which the metrics in the table will be calculated. The options are shown in the image below.
![]() This drop down allows you to choose which patient type you want to focus on.
This drop down allows you to choose which patient type you want to focus on.
| Metric | Description |
| SNF Name | The official entity name of the skilled nursing facility as listed in CMS Provider Data (NPI) file |
|
Favorites/Targets
|
Click on these icons to make the listed organization a Favorite (heart icon) or a Target (target icon). |
| NPI | National Provider Identifier number for the skilled nursing facility in the row. This is maintained by CMS. |
| Trella Inferred Parent Network | If the listed skilled nursing facility is aligned with a Trella Inferred Patent Network, the network ID is identified in this column. |
| ZIP Code | This is the ZIP Code the skilled nursing facility has listed as their primary location, as pulled from the NPI Registry file. |
|
SNF Patients (Inpatient ) |
This metric is the count of distinct patients treated by the selected facility in the setting indicated (Inpatient, outpatient, etc.) who were admitted to the skilled nursing facility in the row during the one year reporting period.
|
| Affiliation % | This metric is the percentage of distinct patients discharged from selected facility who were admitted to the skilled nursing facility identified in each row during the one year reporting period. |
|
Distinct Patients - Counts by Quarter - 20YY-Q# |
This is the count of distinct patients treated by the selected facility who were admitted to the listed skilled nursing facility during the quarter listed in the column header.
|
| Trended Patients |
This contains a graphical presentation of the Distinct Patients metrics to the left. This shows a visual trend of the patient admits to allow a quick evaluation.
|
| Average Medicare Days per Stay | Average number of Medicare-covered days spent in the listed skilled nursing facility for patients who were discharged from the facility and admitted to the skilled nursing facility within 30 days after discharge during the one-year reporting period |
| Hospitalization Rate: Stay + 30 Days | The two-year rate at which all patients admitted by the named skilled nursing facility were admitted to any hospital during their stay or within 30 days after discharge. |
| Readmission Rate: 30-Day | The percentage of patients discharged from any inpatient setting who were admitted to the listed skilled nursing facility and subsequently readmitted to a hospital within 30 days of the first inpatient discharge (based on a two-year reporting period, shifted back 30 days) |
| Facility Specific Hospitalization Rate | The rate at which patients admitted ONLY FROM THIS FACILITY by the named skilled nursing facility were admitted to a short-term acute stay during or 30 days after discharge from their Hospice episode. |
| SNF Patient Risk Score |
Average Hierarchical Condition Category (HCC) Patient Risk Score for the listed provider
|
| SNF Risk Category |
Trella Health has created these categories to make a general comparison between agencies quick and easy.
|
